Oops! This page is not mobile-friendly yet. Please view it on a larger screen.
Sorry for the inconvenience; check back soon for a responsive version!
Q&A visualization generator
Microsoft Power BI // Web & desktop // AI, NLP, data viz
Overview
Don't want to read the full case study? Watch a demo video instead.
Feature summary
Sometimes, the fastest way to understand your data is to ask a question. Q&A lets customers ask questions in their own words, and gives answers in the form of data visualizations.
Timeline
Three major scenarios spread between 2018 - 2020
Role
Lead designer (UX, interaction, and visual design)
Teammates
PM, content designer, design researcher, front- and back-end engineers
Problems and goals
Q&A had been a feature in Power BI for years, but with extremely low usage. My researcher and I wanted to discover why usage was so low and solve any easy issues.
Problem 2: Inconsistent experiences
Over the years, different, disconnected Q&A experiences had been added to Power BI, which customers cited as a point of confusion. Our goal was to create one straightforward way to use Q&A.
Originally, Q&A could only answer a question accurately if it was formed with terms from the underlying metadata. But we learned that most Q&A users, like CEOs or delivery drivers, knew nothing about their metadata. To account for this, we made a way for data analysts to train Q&A to understand how their end-users naturally ask questions.
Problem 1: Low usage
Personas
Q&A is intended for use by two personas, Ash and Nat. Ash is a data analyst who creates reports for others to consume. Ash knows the data well, and might use Q&A to quickly create visuals on a report page.
Nat is a CEO, delivery driver, or anyone who relies on Ash's reports to do their job. If Nat has a data question, they typically reach out to Ash -- a huge inconvenience if an urgent question comes up in the boardroom or out in the field. Q&A lets Nat get answers about their data without involving Ash.
Discovery
We knew Q&A wasn't working -- it had fewer than 10k monthly active users (MAU). To find out what wasn't working, I worked with our researcher, James, to design a usability study. We tested Q&A with existing Power BI users who fit Ash and Nat personas.
Identifying problems
Through heuristic analysis, I found a number of UI-related usability issues. James confirmed many of these through user research, plus he discovered another huge pain point: the words Nat used to ask questions rarely matched the metadata used by Q&A to find answers.
For example, Nat might ask a question in natural language:
What were my sales in Q4?
but if the desired data were stored in a column called "US_prod_sales" (instead of "sales," as asked) Q&A might produce an unexpected answer.
Over and over, we met customers who were very excited by the concept of Q&A, but the feature's usability and language issues made it essentially useless.
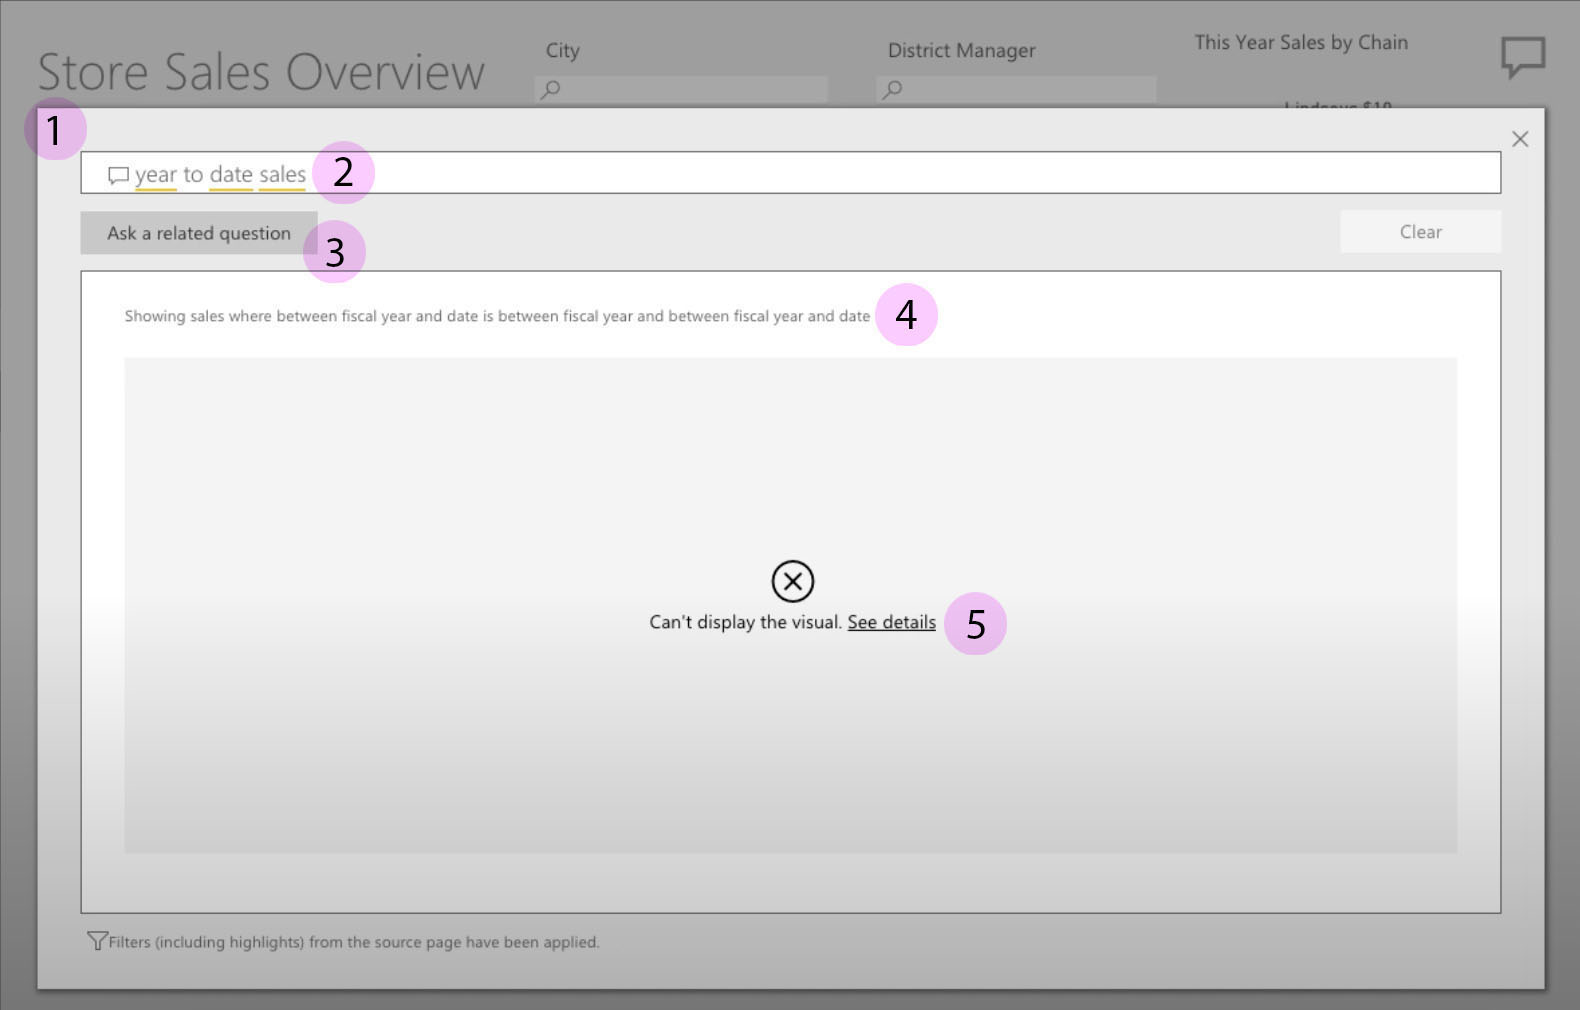
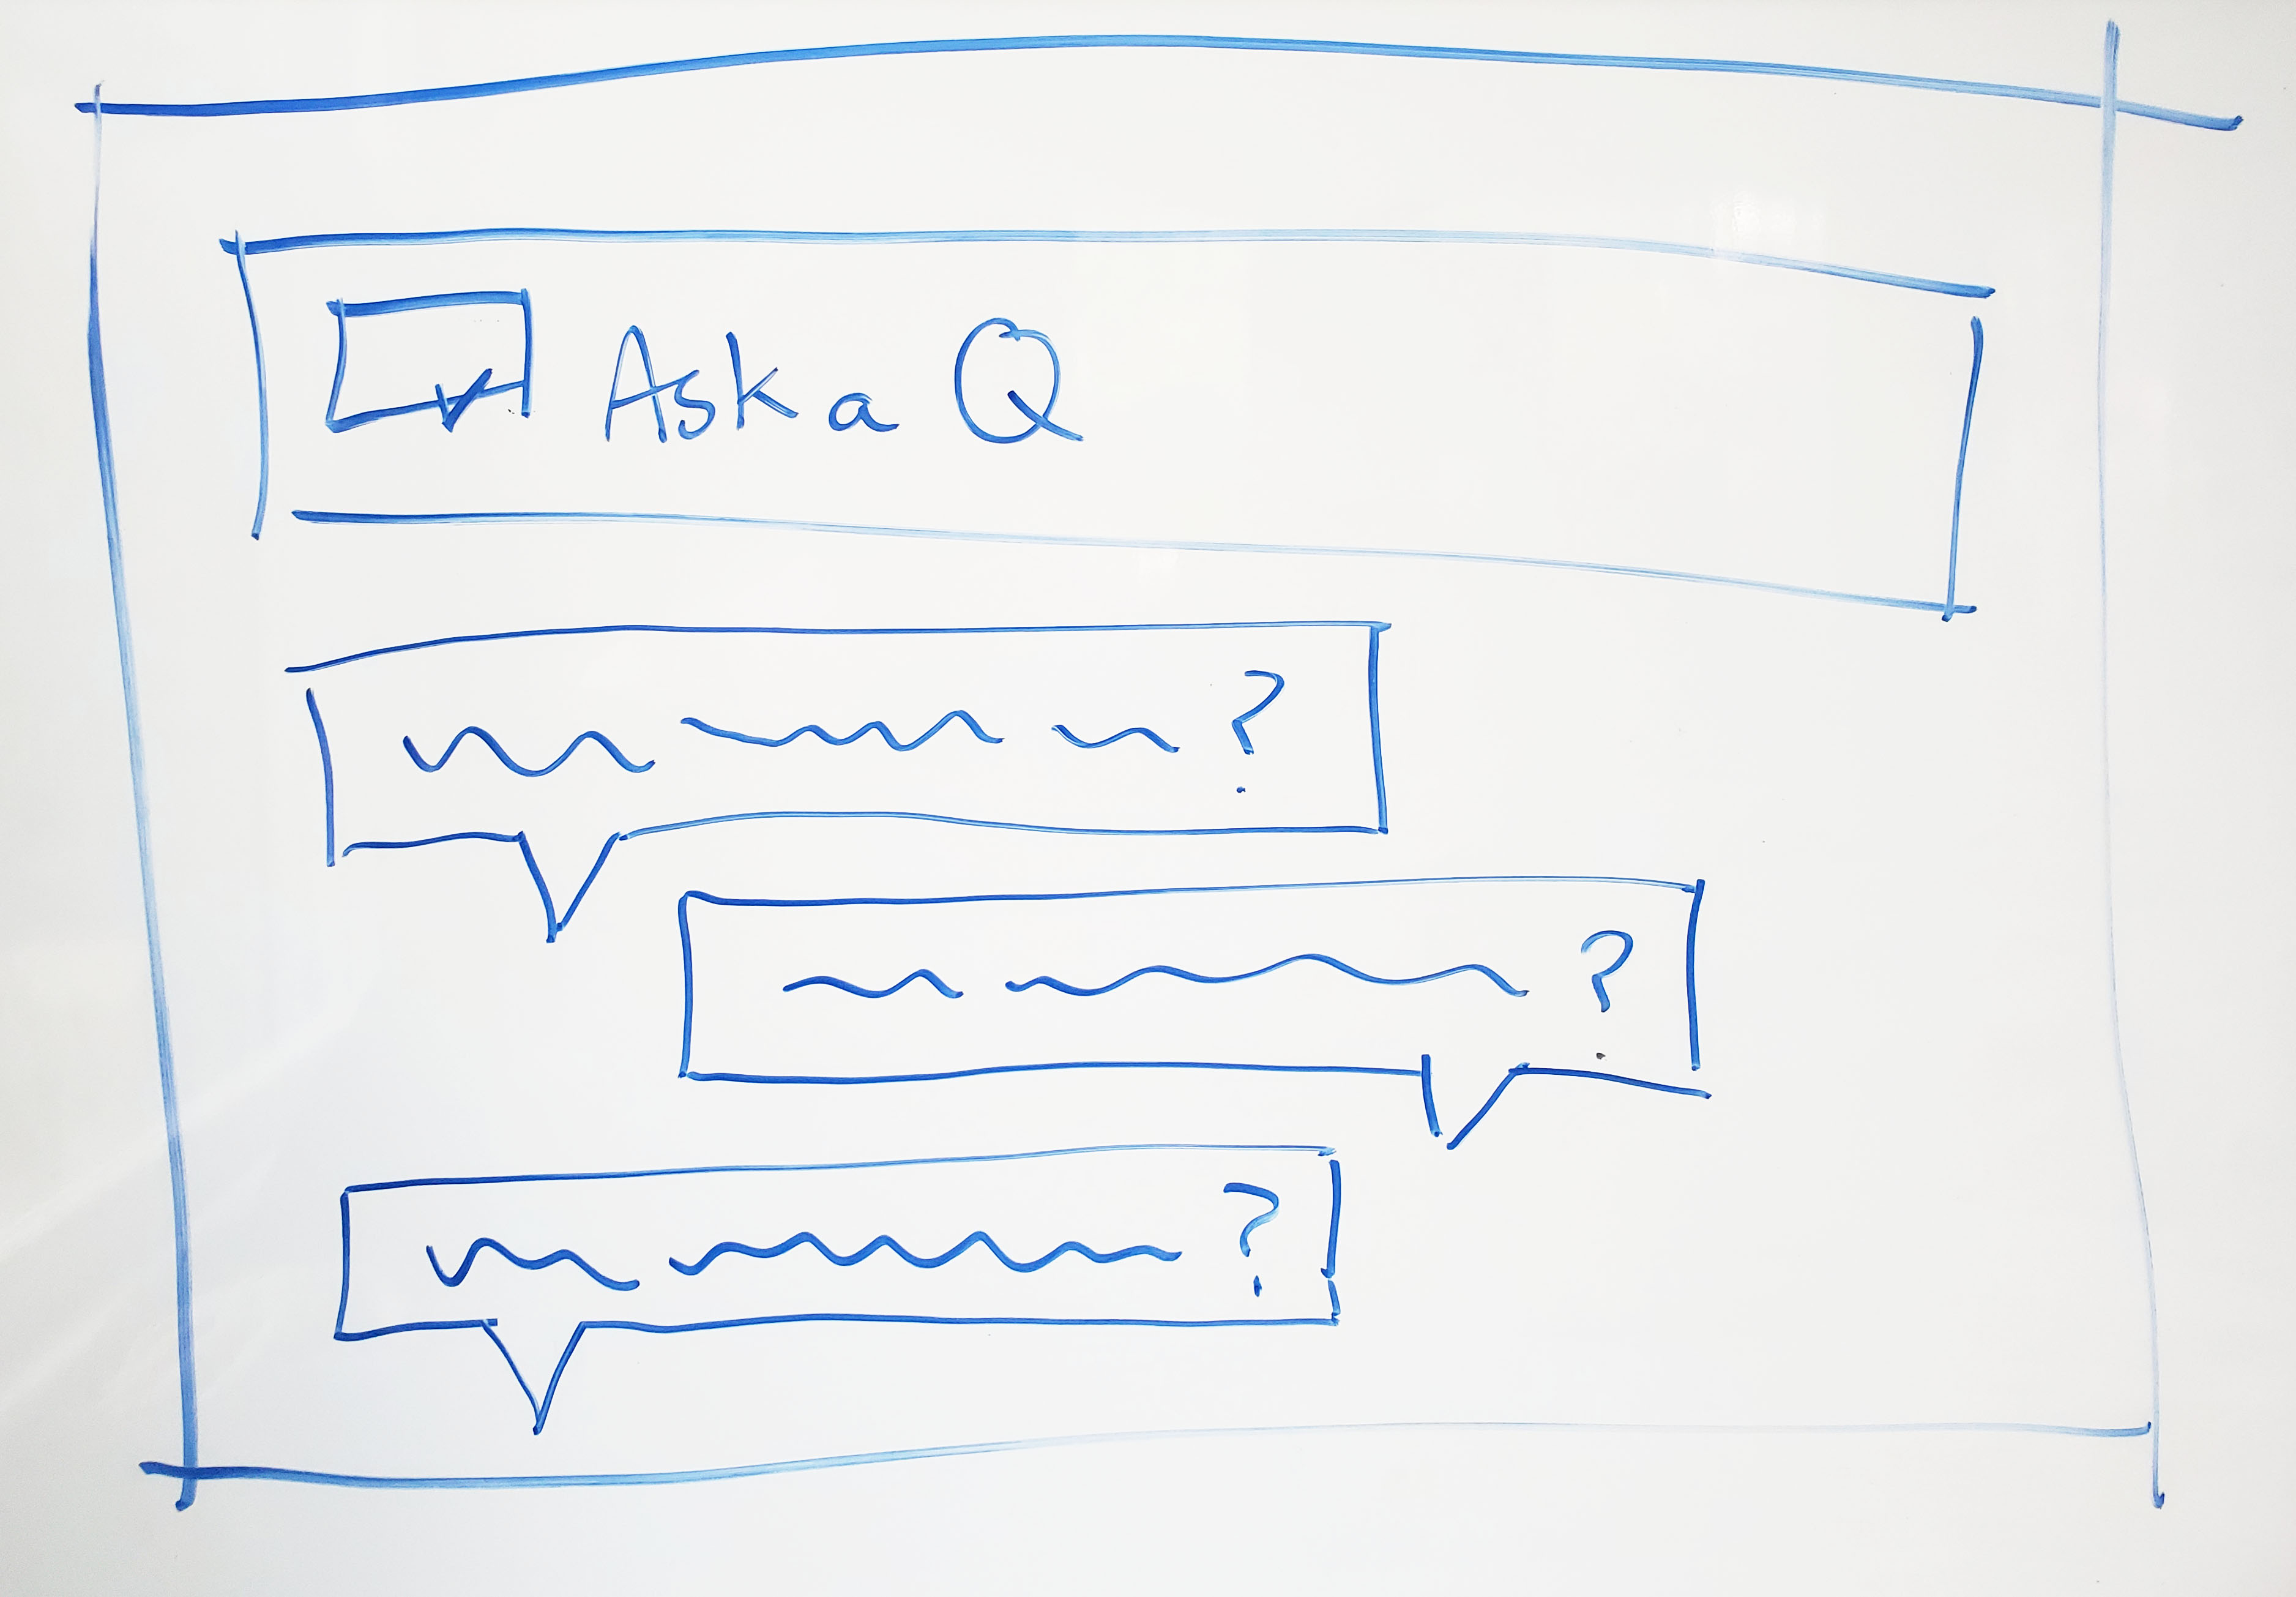
Figure 1. Existing usability issues. (1) When Q&A was in a pop-up, users lost context of the report in which they'd been working. (2) All nouns were underlined, with no indication of whether Q&A understood them or used them in the answer. The yellow underline was difficult to see on the white background. (3) Users could click a button to ask follow-up questions, but the experience was half-baked and confusing. (4) Q&A restated its answer in words, which were often this confusing. (Just read it!) (5) If Q&A couldn't answer a question (which happened often) users were given a link to unhelpful, technical details, with no suggestions for how to recover.
Design recommendations
It would be another year before our engineers could implement natural language processing (NLP) to solve language-related pain points. In the meantime, we could address UI-related pain points. I studied common search tools like Google (sorry, Bing) to identify paradigms that would be familiar to Nat and Ash, and put together a package of "quick-win" design recommendations.
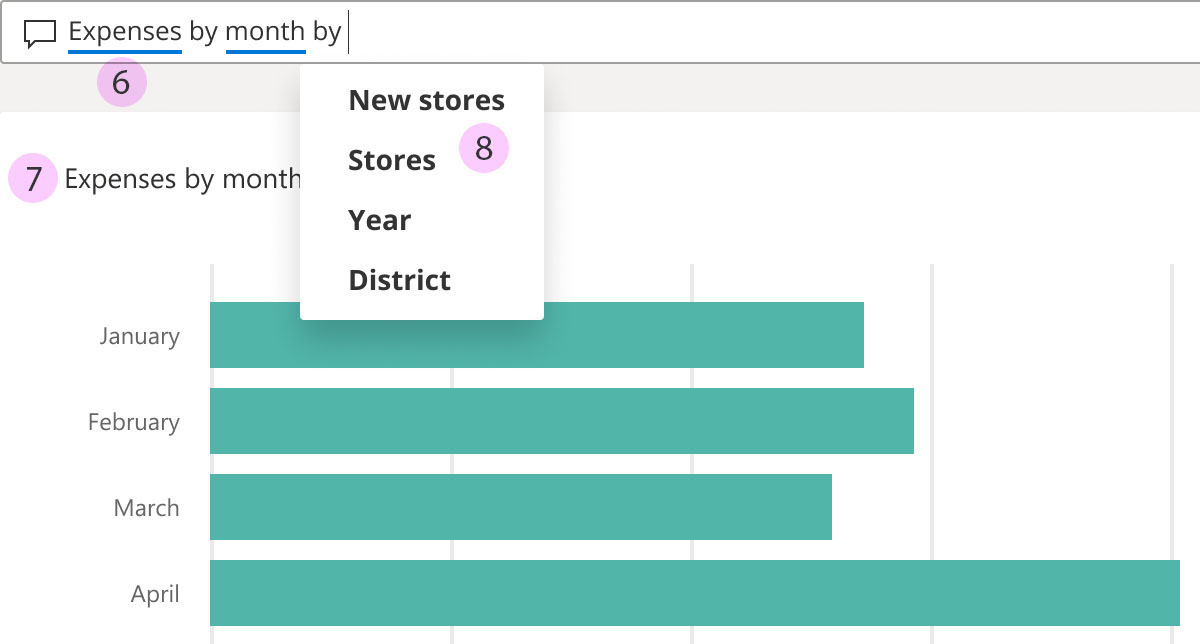
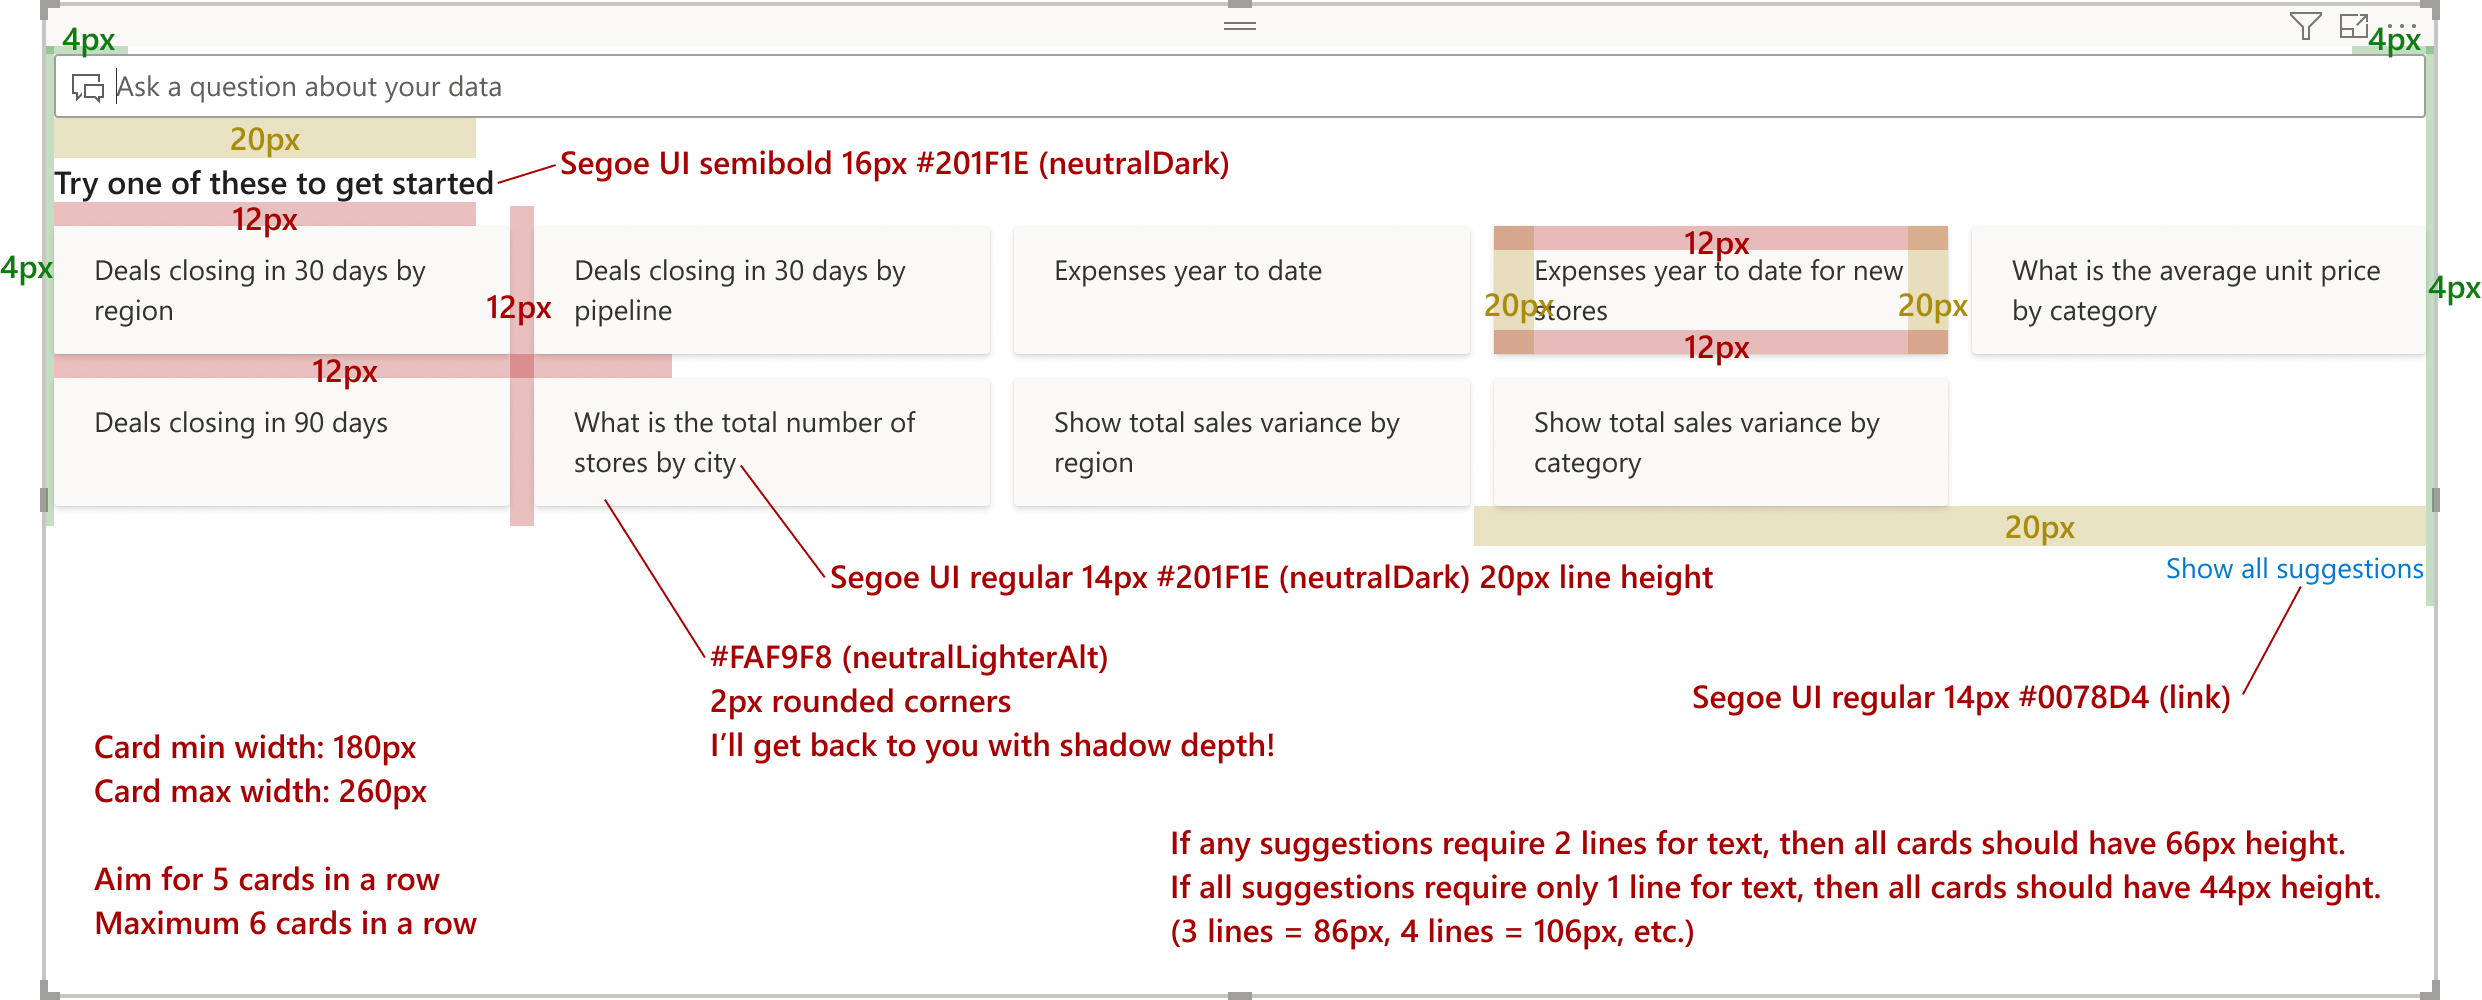
Figure 2. Quick-win design recommendations. (6) Use colors with accessible contrast. (7) State results in friendlier language. (8) Suggest terms as users type. (Not pictured) Remove the half-baked "Ask a related question" button.
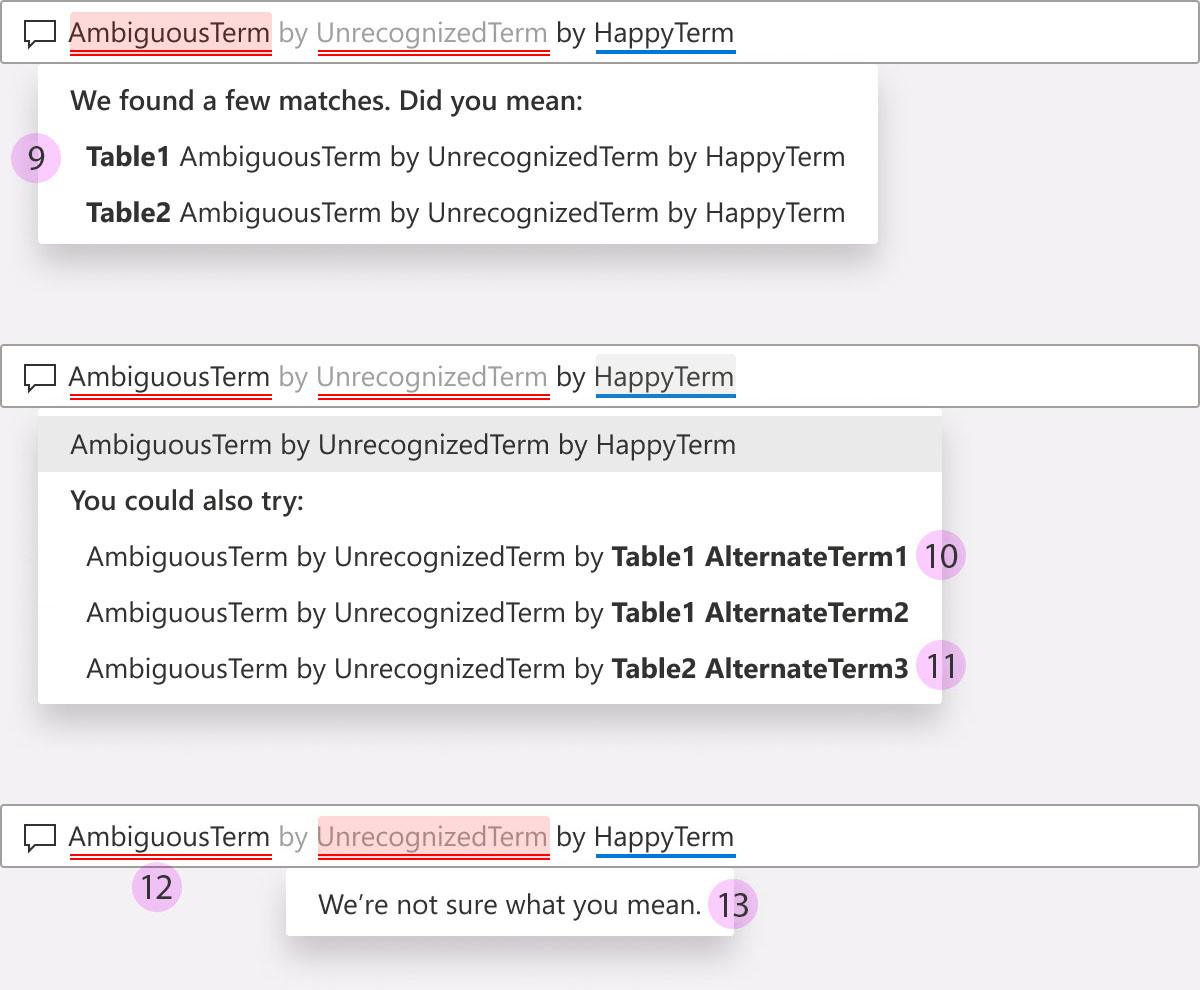
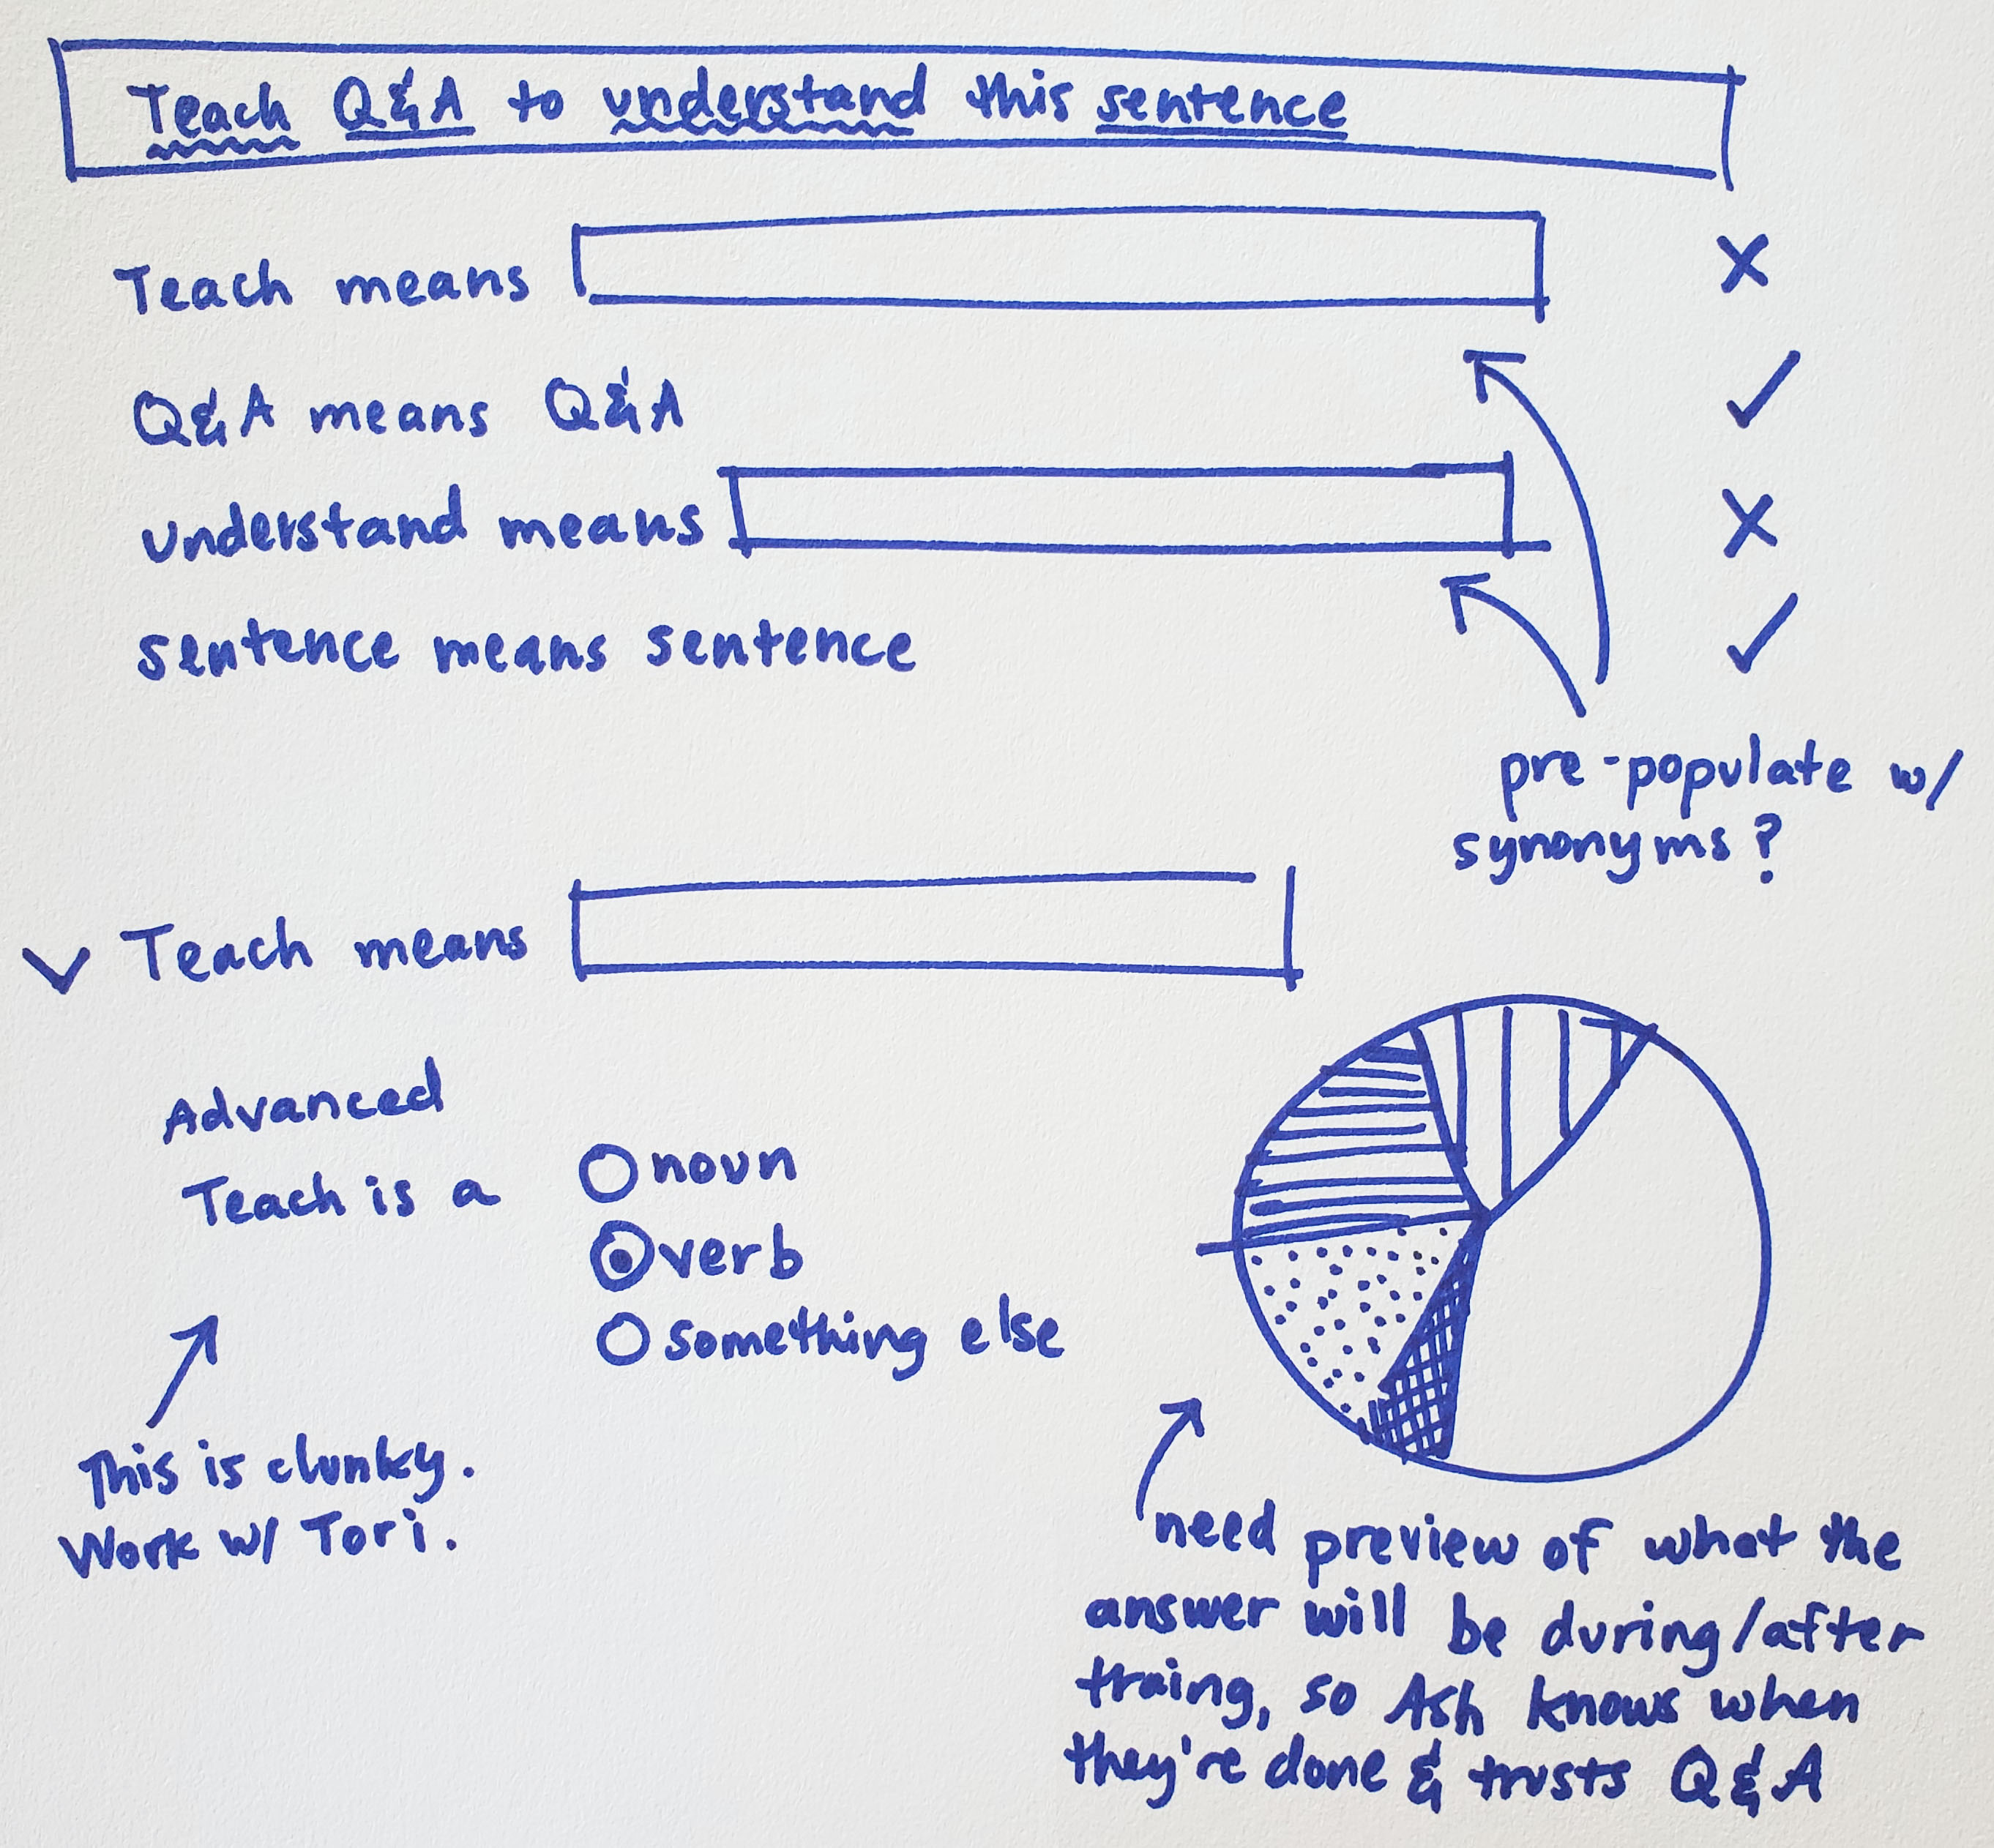
Figure 3. Design recommendations. Make terms clickable, with a dropdown that (9) suggests how to fix errors or (10) suggests alternate terms that might be of interest. (11) Use bold to highlight Q&A's suggestions. (Previously, Q&A bolded the part users had typed.) (12) Use a double-underline to indicate terms with errors, instead of relying on color alone to distinguish errors from accepted terms. (13) Make it clear when Q&A doesn't understand a term. (We wouldn't have the techincal ability to help users recover from these errors until later.)
Outcome
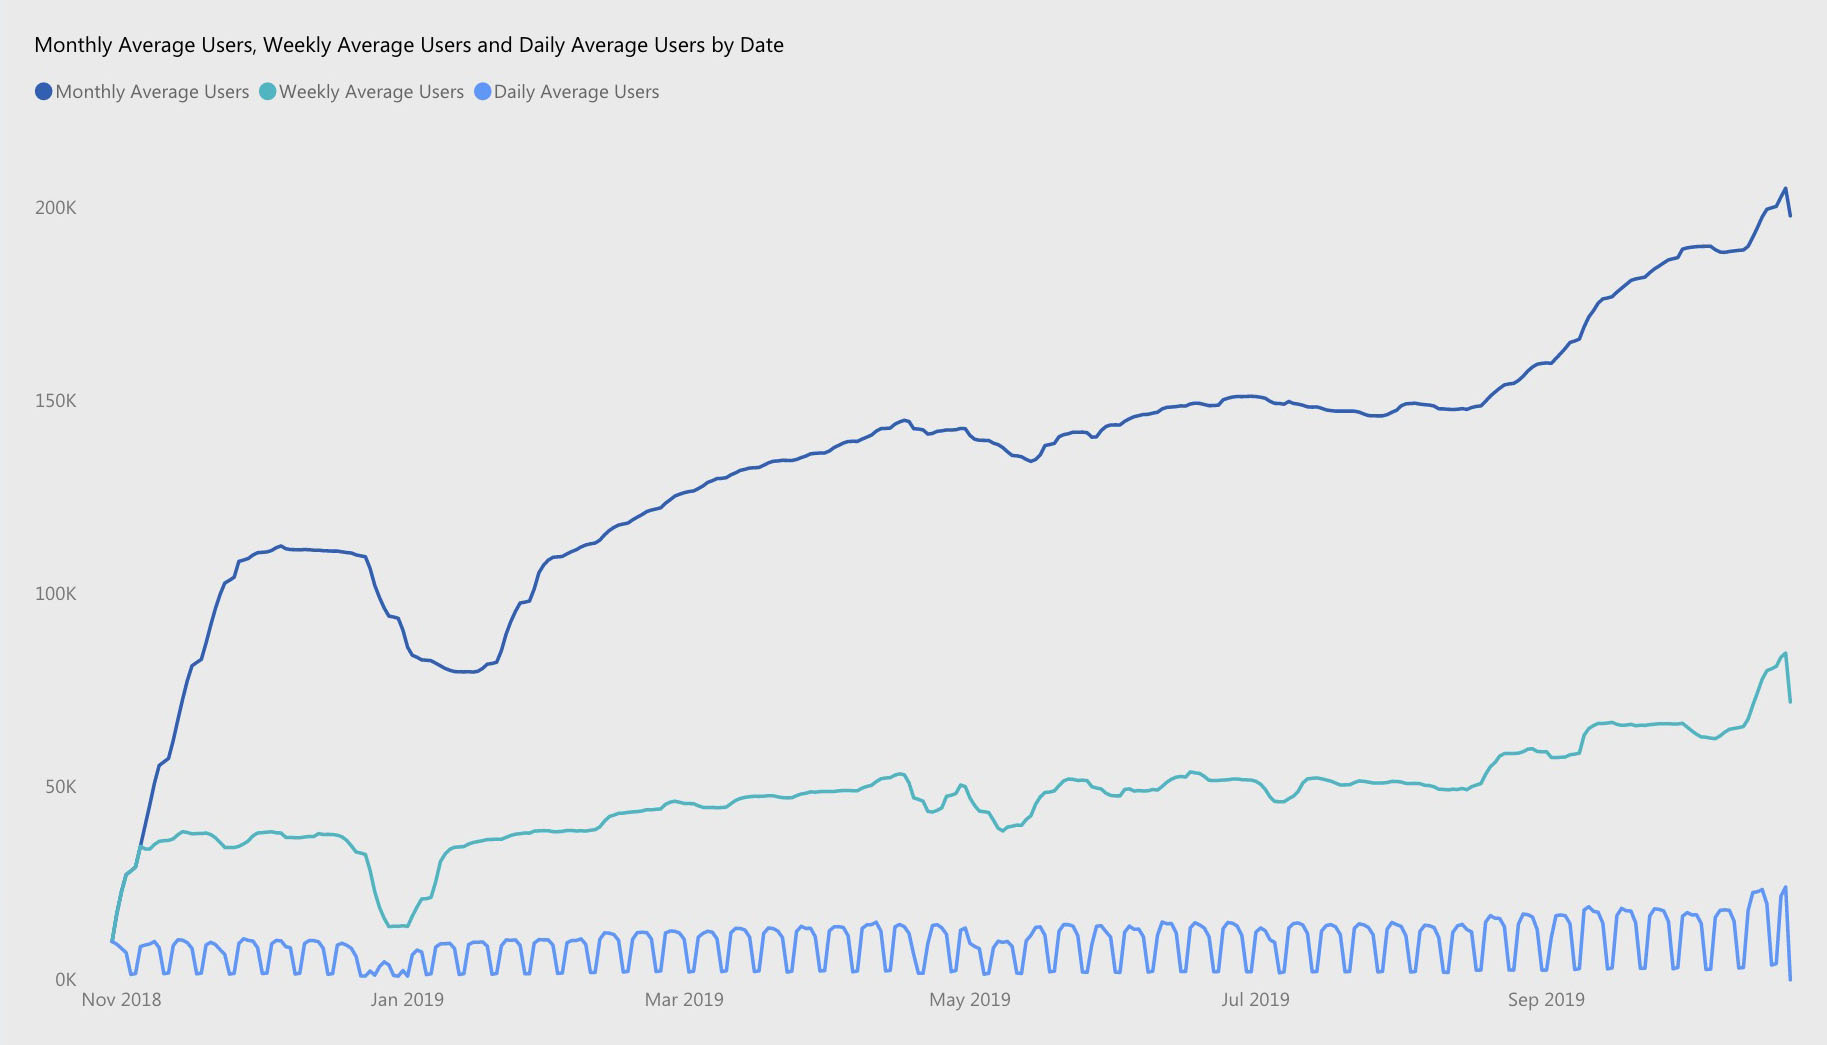
With the help of our PM and front-end engineer, we launched many of the quick-win design recommendations, along with a new Q&A visual (more on that in Problem 2). After releasing the improvements, we saw a huge increase in discoverability and repeat usage -- from 10k monthly active users of the old Q&A, to 110k MAU of the new Q&A visual in its first month, with a steady increase over the next year!
Problem 2: Inconsistent experiences
Multiple experiences, none of them good
Over the years, disconnected Q&A experiences were added to different parts of Power BI. Each version was confusing in its own way and, understandably, users felt lost.
Moving to a single, good experience
The heart of Power BI is data visualizations. Our front-end engineer, Eeshan, came up with the idea to turn Q&A into its own visualization, to replace the other half-baked Q&A experiences. We worked together to create a usable, straightforward version of Q&A that data analysts could add to any report, as a first-class tool, customizable to match the report's brand styling.
Process
The Q&A visualization was one of the breeziest high-impact projects I've worked on, coming together in a matter of weeks, mostly through whiteboarding sessions with my engineer, Eeshan.
Eventually, my work moved from whiteboarding to redlines. Power BI's style guide was in flux at the time, so it was important to call out stylistic details. Sitting with Eeshan, I gave design guidance on UI, interactions, animations, and content, making sure everything was consistent with other Power BI visualizations. Eeshan rocked the rest.
Outcome
Users report that they love the new Q&A visual, and this is supported by telemetry (see Figure 4 above). Now that there's a successful way to use Q&A with Power BI reports, the two other ways of using Q&A with reports are being depricated. A future step will be to redesign the Q&A experience for dashboards, using any information the team can glean from the new visual's success.
Press
Problem 3: Inaccurate results
The biggest problem of all
Despite the success of the new Q&A visual, we continued hearing from customers that Q&A wouldn't work for their company until it could understand their users' questions. As our researcher discovered early on, Q&A's accuracy depended upon whether the words in someone's question matched the terms in their metadata, but most end-users knew nothing about metadata.
Many people who tried to use Q&A were frustrated when they got unexpected answers or, even worse, they were at risk of making business decisions based on Q&A's misleading answers.
Working through a support case now where Q&A was not understanding the Q, so no A. ... Unfortunately the new Q&A visual STILL doesn't recognize the phrase.
- Todd C, Power BI customer (IT admin)
A solution
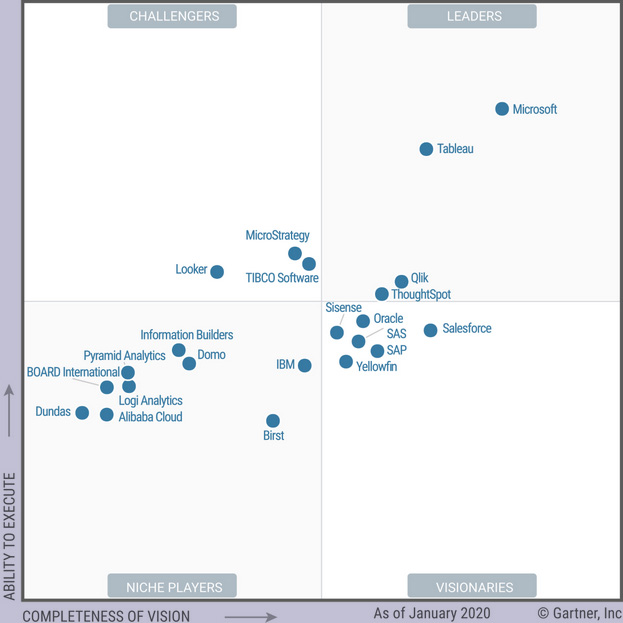
Several other products, notably ThoughtSpot, offered features similar to Q&A. ThoughtSpot allowed customers to train their product to understand how people at their company might ask questions, making it possible to receive better answers. Power BI needed something similar.
Unfortunately, because of licensing limitations, and because features like this were still rare, we weren't able to do much competitive analysis. Instead, I studied tools like Microsoft's Language Understanding Intelligent Service (LUIS), to learn how minimally-technical users might train AI. And fortunately, we had a team of brilliant engineers, PMs, and designers who loved tricky problems!
Process
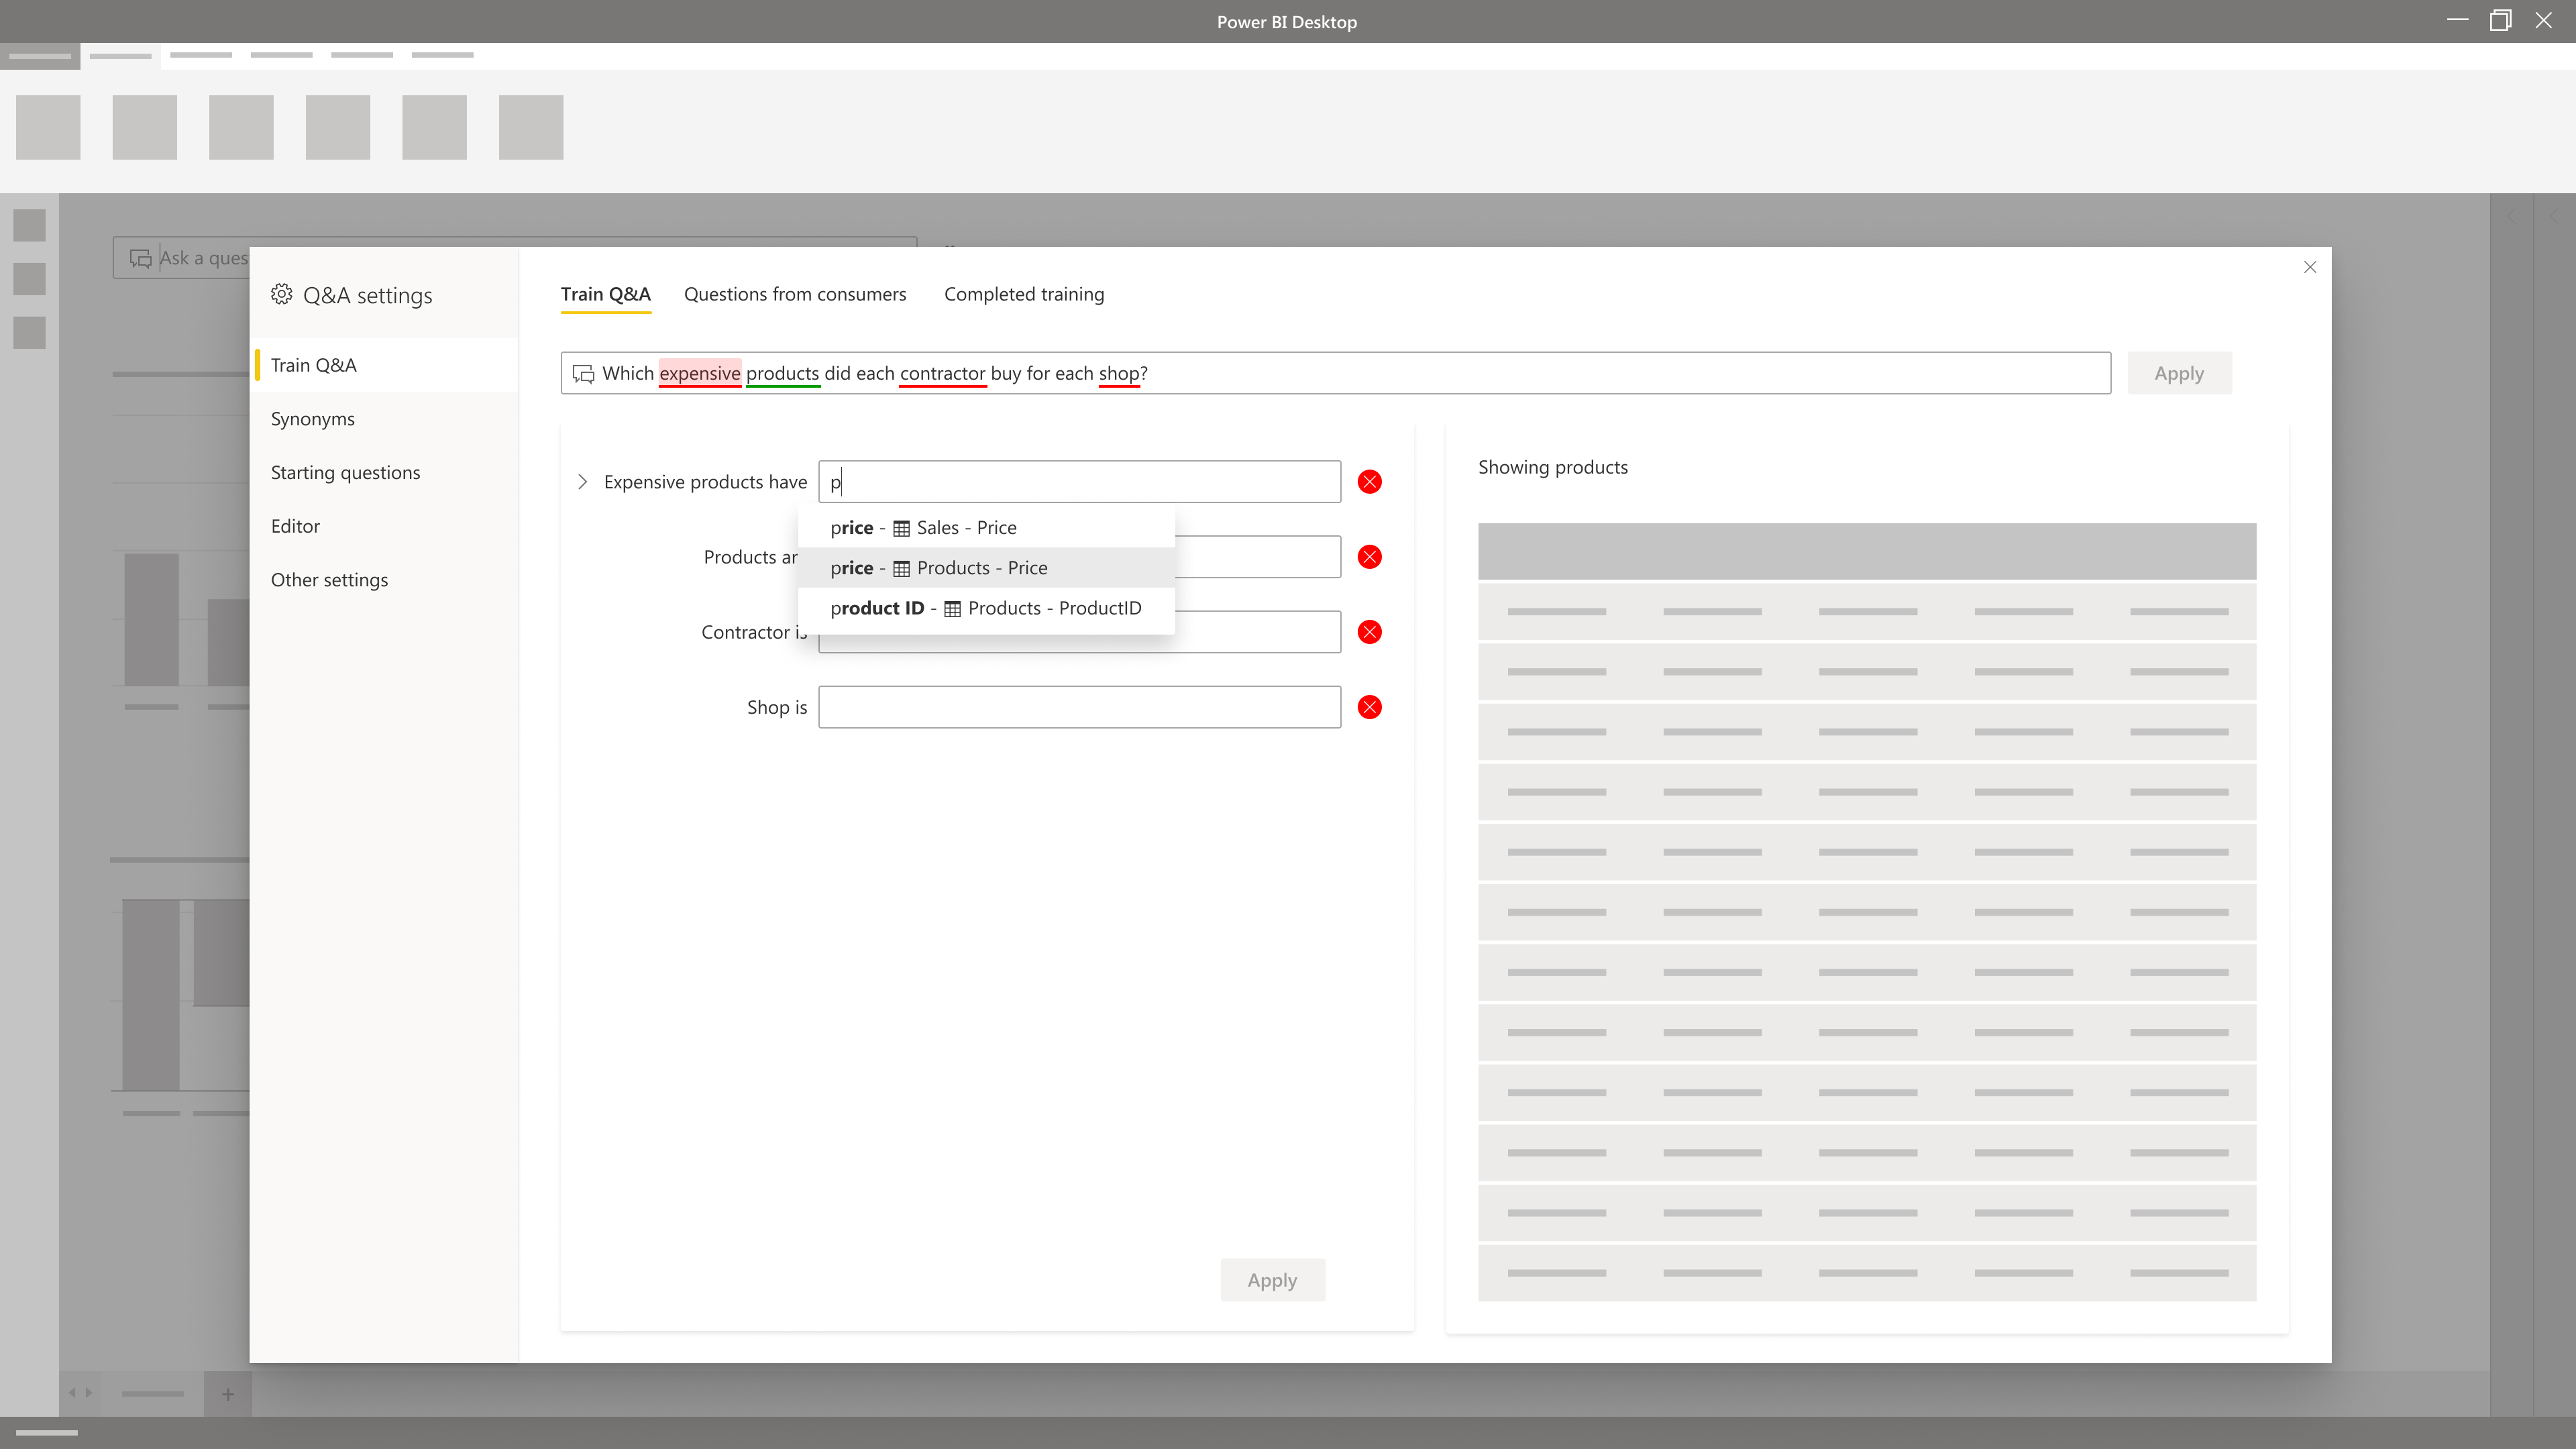
For months, my content designer, researcher, and I met with our engineering team to work through the complex scenario before us: how to guide data analysts through training a natural language search engine. We did hours of whiteboarding, brainstorming, and debating. I built wireframes and prototypes, and collaborated with my new researcher, Carly, to design and run user studies.
We divided the giant scenario into parts that could be released independently:
Wireframes
Outcome
Q&A is among the pioneering technologies that could democratize data, making accurate data analysis accessible to more people, even those without extensive training.
We got huge cheers when we demoed [how to train Q&A] and it's awesome to see us on the right track.
- Mo, our Q&A PM, after the 2019 Power BI MVP Summit
The first parts of Q&A training were released as public preview in October, 2019. The next step will be to gather sentiment, usage data, and customer feedback, so the feature can be improved before general availability.
This whole project was a fantastic collaboration between design, engineering, and PM. My content designer, researcher, and I had seats at the table alongside our engineers, and everyone valued each other's contributions. I couldn't have asked for a better team.
Press